Sustainable Energy in America 2023 Factbook
Tracking Market & Policy Trends
The Sustainable Energy in America Factbook provides valuable year-over-year data and insights on the American energy transformation.
Key Trends
The 2023 Sustainable Energy in America Factbook, produced annually by BloombergNEF in partnership with the Business Council for Sustainable Energy, tracks energy market and policy trends in the United States. The Factbook examines how clean energy sectors performed in 2022 and over the past decade.
Need a PDF instead?
The clean energy transition is now hard-wired
into the U.S. economy.
1
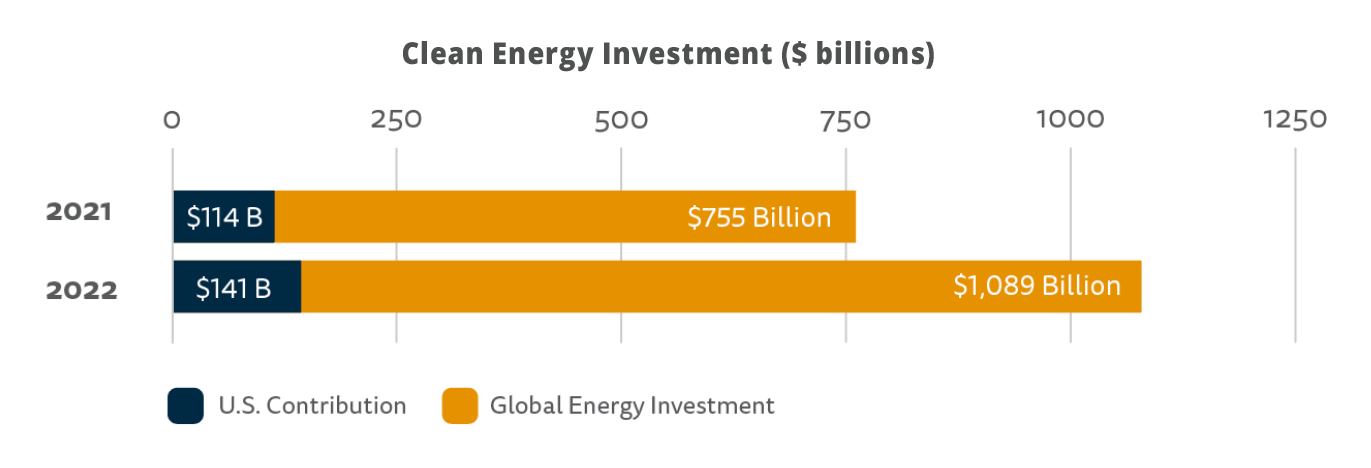
Global private investment in the energy transition shattered records in 2022, rising to over $1 trillion, with the United States attracting the second-highest level of investment at $141 billion.
FACTS
- The injection of $141 billion in new private capital in the U.S. energy transition in 2022 was an 11 percent increase over 2021. The 2022 total included $57.3 billion in electrified transport (41 percent) and $49.5 billion in renewable energy (35 percent).
- The U.S. federal government made a historic $369 billion investment to advance the energy transition with the enactment of the Inflation Reduction Act. By year’s end, electric vehicle and battery manufacturers raced to identify investment opportunities, announcing almost $17 billion of commitments to the North American battery supply chain.
- Large corporations continued to drive clean energy demand in the U.S., signing contracts to procure a new annual record of 19.9 gigawatts (GW) of renewable energy in 2022, up from 17.1 GW in 2021.
WHY IT MATTERS
Clean energy is thriving. The record levels of private sector investment in both the U.S. and around the world in 2022 point to the durability of the energy transition, even when faced with inflationary and supply chain pressures. Corporate demand, coupled with a historic public sector injection of capital into U.S. infrastructure, is sure to exponentially expand the reach of the clean energy transition, which is rooted in a diversified portfolio of energy efficiency and clean energy.
2
The BCSE portfolio of clean energy solutions provide the majority of U.S. electricity. The share of U.S. electricity demand met by natural gas and renewable energy increased to 62 percent in 2022, up from 43 percent in 2012. Renewable energy broke records, meeting 13 percent of total energy demand and 23 percent of electricity demand.
FACTS
-
Total U.S. power generation increased 3.4 percent in 2022. Natural gas remained the largest source of U.S. electricity, providing 39.4 percent of the total – with 1,694 terawatt-hours (TWh) of production in 2022, up 6.5 percent from the year prior. The contributions of renewable energy sources – including biomass, geothermal, hydropower, solar, waste-to-energy, and wind – rose at the fastest pace of all energy sources, increasing 12.6 percent and producing 974 TWh in 2022. Coal-fired generation fell to 19.4 percent of the power generation total, and nuclear generation delivered 18 percent.
-
Among renewable technologies, wind was the largest generating source. The nearly 149 GW wind fleet produced 435 TWh of electricity in 2022. That was followed by hydroelectric generation at 261 TWh, up from 252 TWh in 2021. Production from all types of solar generating projects hit 207 TWh in 2022, making it the third-largest renewable generating source. Rooftop solar on residential and commercial buildings represented 35 percent of all solar installed capacity in 2022.
-
An estimated 43 GW of new power generation capacity was commissioned in 2022. Renewable energy was the dominant source, adding 32 GW of wind and solar capacity in 2022. This was down 5 GW from 2021 as developers faced supply chain constraints, higher input costs, and tax credit uncertainty. Energy storage set a record with 4.8 GW added.
-
21 megawatts of new biomass and waste-to-energy capacity came online in 2022. Local municipalities like Miami Dade and Pasco counties in Florida publicly announced intentions to expand or build new waste-to-energy capacity.
WHY IT MATTERS
2022 was a record-shattering year for both clean energy finance and technology deployment. Unpredictable headwinds remain the norm for energy markets: obstacles in 2022 included Russia’s invasion of Ukraine and the subsequent impact on global energy markets, as well as high input commodity prices for clean energy technologies. Nevertheless, the U.S. power sector’s transition to cleaner resources endured, showing strong demand by companies, communities, and households.
The passage of the Inflation Reduction Act provides, for the first time, parity and long-term support for the full portfolio of renewable energy technologies; this could help accelerate investment in the slower-growing renewable energy sectors.
3
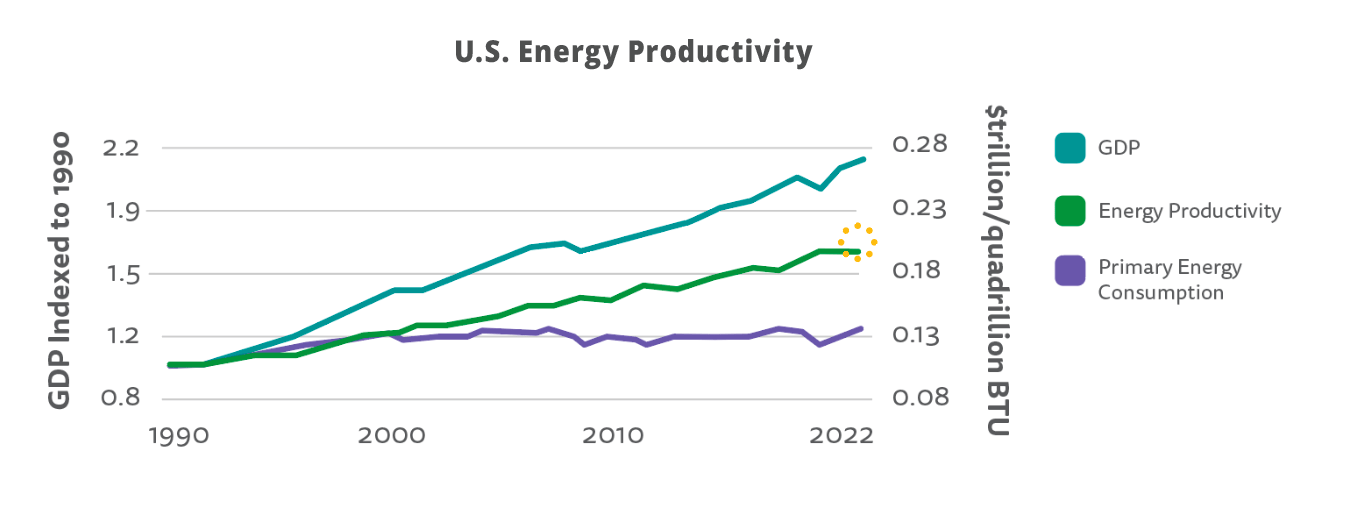
In 2022, the U.S. economy expanded 1.9 percent, and U.S. primary energy consumption rose at a faster clip of 3 percent, returning to pre-pandemic levels. As a result, U.S. energy productivity dipped 1 percent in 2022, but over the past 10 years it has grown 15.2 percent.
FACTS
- Since 1990, the energy productivity of the U.S. economy (GDP output per unit of energy consumed) has improved 79 percent, demonstrating that investments in energy efficiency have paid dividends.
- Contributions from non-hydropower renewables – primarily wind and solar, but also biomass, waste-to-energy, and geothermal – rose 10.2 percent in 2022 to account for 13.2 percent of total U.S. energy demand. The role of natural gas in U.S. energy consumption also continued to grow, rising 5.5 percent year-on-year to account for nearly one-third of the total.
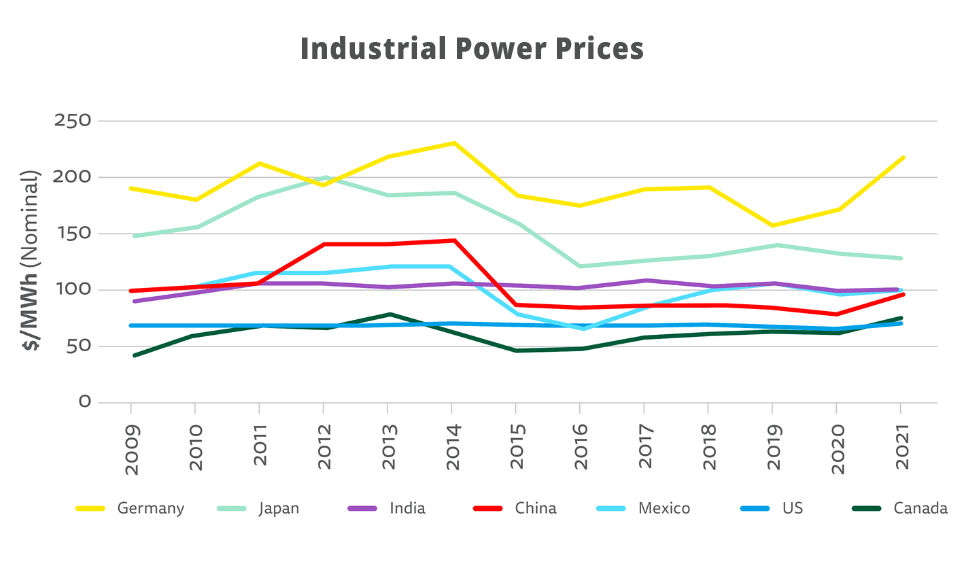
- The U.S and North America offer some of the least expensive electricity in the world for industrial customers, averaging 7.2 cents per kilowatt-hour in 2021 (latest data available).
- Spending on energy efficiency improvements related to electricity stabilized at $6 billion while spending on improving the efficiency of natural gas delivery grew from $1.5 billion to $1.7 billion in 2021 (latest data available).
WHY IT MATTERS
Energy productivity – a measure of economic output per unit of energy consumed in the U.S.– is an essential metric to grade our country’s competitiveness compared to other Group of Seven nations. Energy efficiency is at the heart of meeting U.S. economic competitiveness and decarbonization goals.
The U.S. energy transition requires modernized, expanded, and resilient infrastructure to avoid the worst impacts of climate change and to enable the continued delivery of reliable and affordable energy.
4
2022 marked the third most costly climate disaster year on record, with U.S. greenhouse gas emissions inching up 1 percent. These trends call for the urgent acceleration of the speed and scale of the deployment of clean energy and energy efficiency solutions.
FACTS
-
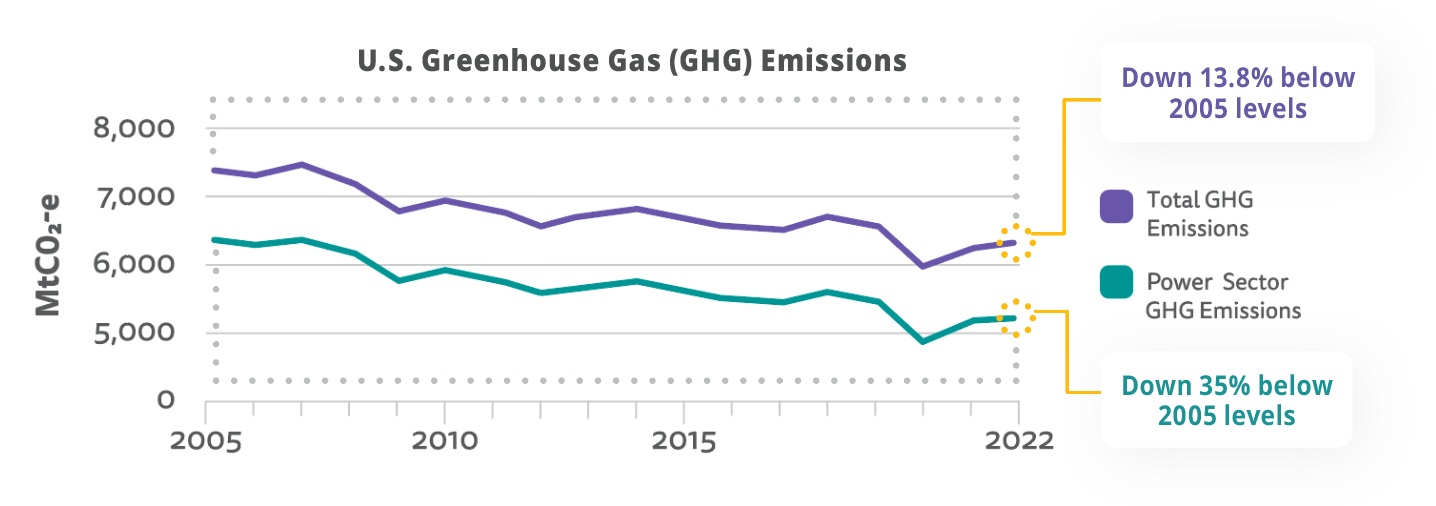
U.S. economy-wide greenhouse gas emissions rose 1 percent in 2022 following a 5.8 percent increase in 2021, but emissions remained 3 percent below pre-pandemic (2019) levels and 13.8 percent below 2005 levels.
-
Power sector emissions dipped 1.5 percent and are now 35 percent below 2005 levels.
-
Transport sector emissions rose 1.4 percent in 2022 and remain the largest source of emissions.
-
Climate-related disasters caused $165 billion in damage in 2022, making it the third most costly year on record. Eighteen of these disaster events individually caused more than $1 billion in damages. Three tropical cycles accounted for 70% of the $165 billion total. Natural disasters in 2022 forced an estimated 3.4 million Americans to evacuate their homes, according to the U.S. Census Bureau.
WHY IT MATTERS
Emissions from the transport, power, industrial, and agricultural sectors of the U.S. economy all rose in 2022 but remained below 2019 levels. This suggests that some emissions reductions made in 2020 have persisted, particularly for transportation, the top emitting sector, and for the power sector, which has seen steady decarbonization for the last decade due to clean generation and energy efficiency.
The U.S. has pledged under the framework of the Paris Agreement to reduce economy-wide emissions 50-52 percent below 2005 levels by 2030, and current emissions are down only 13.8 percent. For the power sector to “stay on track,” emissions would have needed to fall 6 percent or more in 2022, but they dropped only 1.5 percent [in 2022]. Emissions in all other sectors would have needed to fall 0.9 percent but instead rose 1.9 percent.
Climate-related disasters place undue strains on public coffers and community well-being. The energy system is critical infrastructure that needs immediate attention to avoid the negative consequences of extreme weather and natural disasters.
5
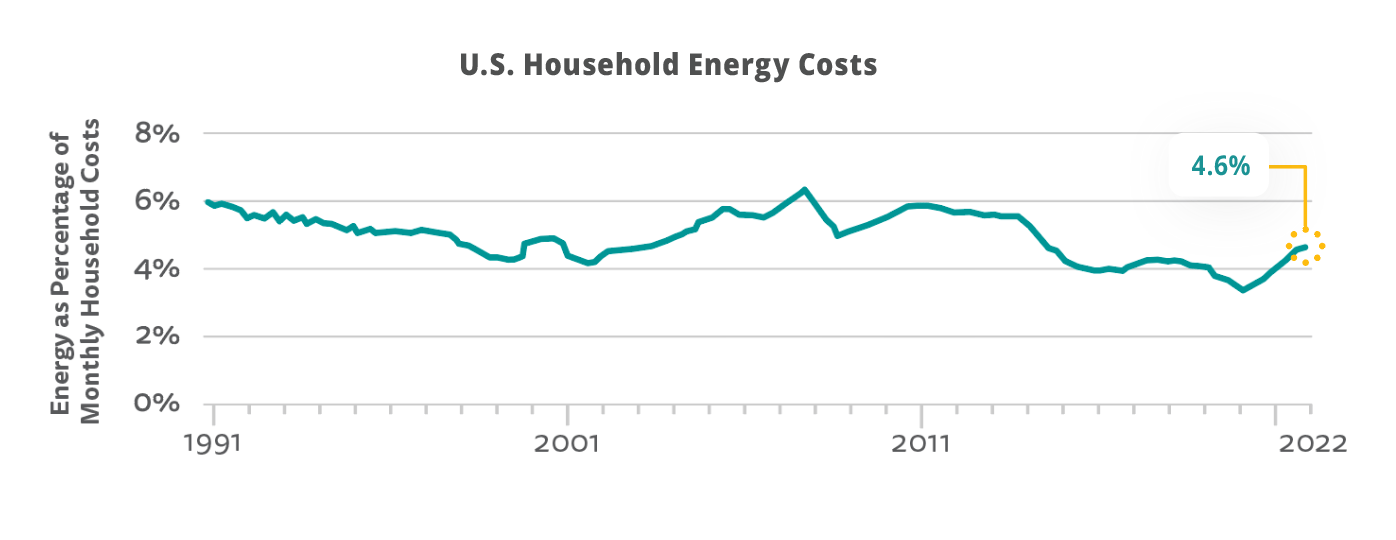
Relative energy costs of U.S. households remained historically low in 2022, even as consumers faced price increases due to supply chain disruptions and inflation.
FACTS
-
Energy spending accounted for 4.6 percent of total U.S. personal consumption expenditures in 2022, up 0.63 percentage points from 2021 levels.
-
Nationwide, 1.74 percent of household expenditures went to electricity and natural gas in 2022, up only slightly from the 2021 level of 1.63 percent. However, transportation-related energy consumption spending rose from 2.1 percent in 2021 to 2.65 percent in 2022.
-
27 percent of U.S. households had difficulty meeting their energy needs in 2020 (the last year for which there is complete data), leading them to forego other necessities to pay an energy bill or to maintain their home at an unsafe temperature, according to the Energy Efficiency Impact Report.
WHY IT MATTERS
Total consumer spending, including on energy goods and services, rose significantly in 2022 as inflationary pressures affected the broader U.S. economy. Yet the monthly cost of energy to an American household, as compared to other expenses, remained below 5 percent in 2022. Even as the U.S. energy economy has transformed over time to embrace cleaner resources and has become more efficient, the energy costs of U.S. consumers have remained relatively low and stable. Nevertheless, millions of households still face challenges paying their energy bills, making further investment in energy efficiency critical, especially in low-income communities.
New and Notable
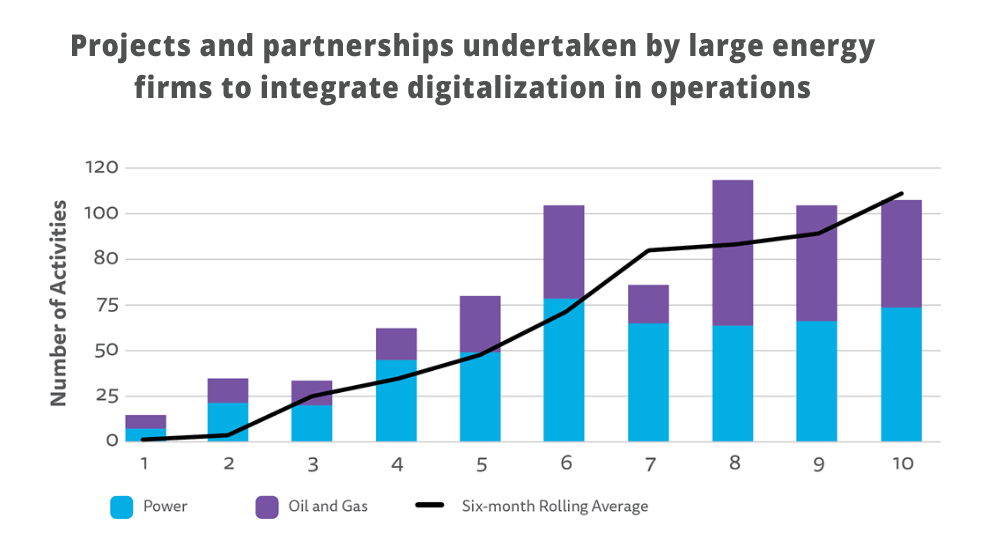
Digitalization technologies are enabling the energy transition.
Take Away
Companies are increasing deployment of digital technologies – software, sensors chips, and drones –to optimize energy systems and track efficiency and carbon emissions.
Dive In
Learn more on Factbook page 46.
The U.S. maintains highly competitive power prices.
Take Away
The U.S. continues to offer industrial customers some of the least expensive electricity in the world, boosting U.S. competitiveness in the global market.
Dive In
Learn more on Factbook page 24.
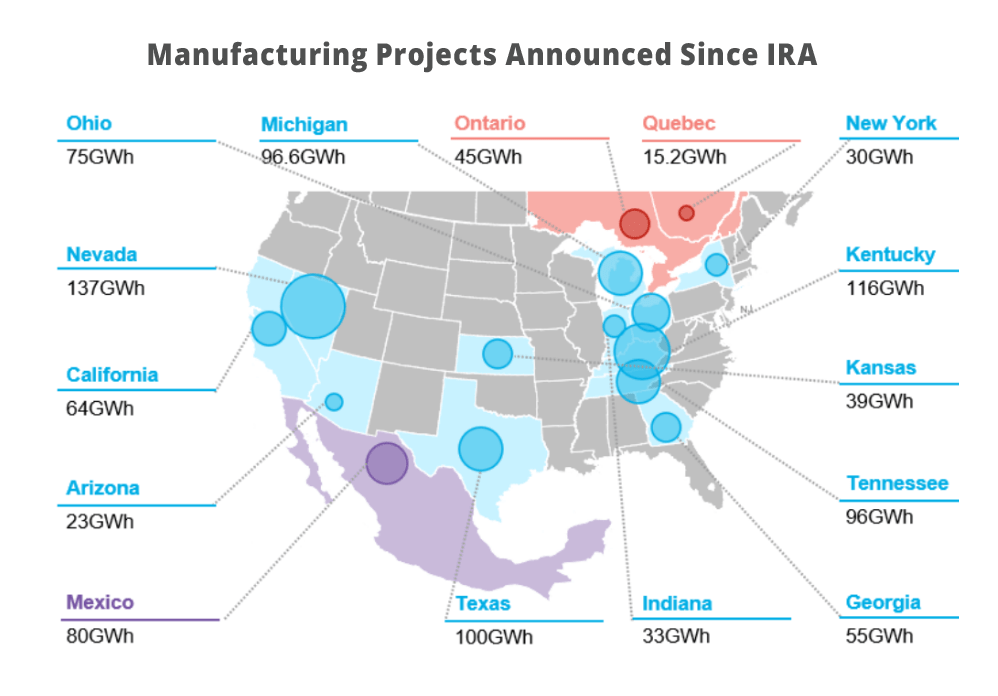
The enactment of the Inflation Reduction Act (IRA) infuses $369 billion in federal support for the energy transition.
Take Away
Post-Inflation Reduction Act commitments to the North American battery supply chain reached almost $17 billion by the end of 2022.
Dive In
Learn more on Factbook page 54.
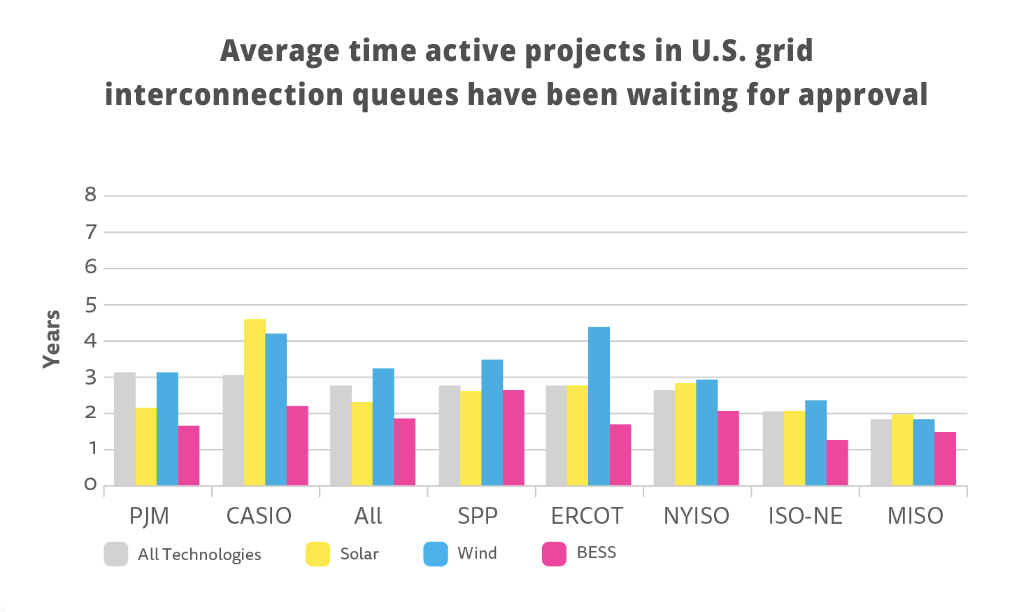
U.S. energy infrastructure needs reform of regulatory timelines
and processes.
Take Away
One recent study found that the majority of energy infrastructure projects take between two and six years to secure all signoffs.
Dive In
Learn more on Factbook page 47.

