
By Chaney Keck, Communications Assistant, BCSE
The passage of the Inflation Reduction Act (IRA) approaches its two-year anniversary this summer, and already, the law’s energy efficiency and clean energy incentives have spurred significant private and public investment in the energy transition.
In the past four months alone, 60,363 additional clean energy jobs have been created, 41 large-scale clean energy projects were newly announced, and 73 new actions were taken by government agencies to implement climate change-related provisions of the IRA. In just the month of April, the Biden administration announced $20 billion in clean energy grants under the Greenhouse Gas Reduction Fund and $7 billion in grants supporting residential solar projects across low and middle-income communities.
As policymakers, climate advocates, and the energy industry work to understand the impact of the IRA’s policies, up-to-data statistics and analysis are crucial. Read on for a sampling of trackers from clean energy industries, federal agencies, NGOs, and BCSE members that catalogue the clean energy project announcements, job creation, and carbon emissions reductions since the enactment of the IRA.
IRA Implementation Progress
2024 Sustainable Energy in America Factbook
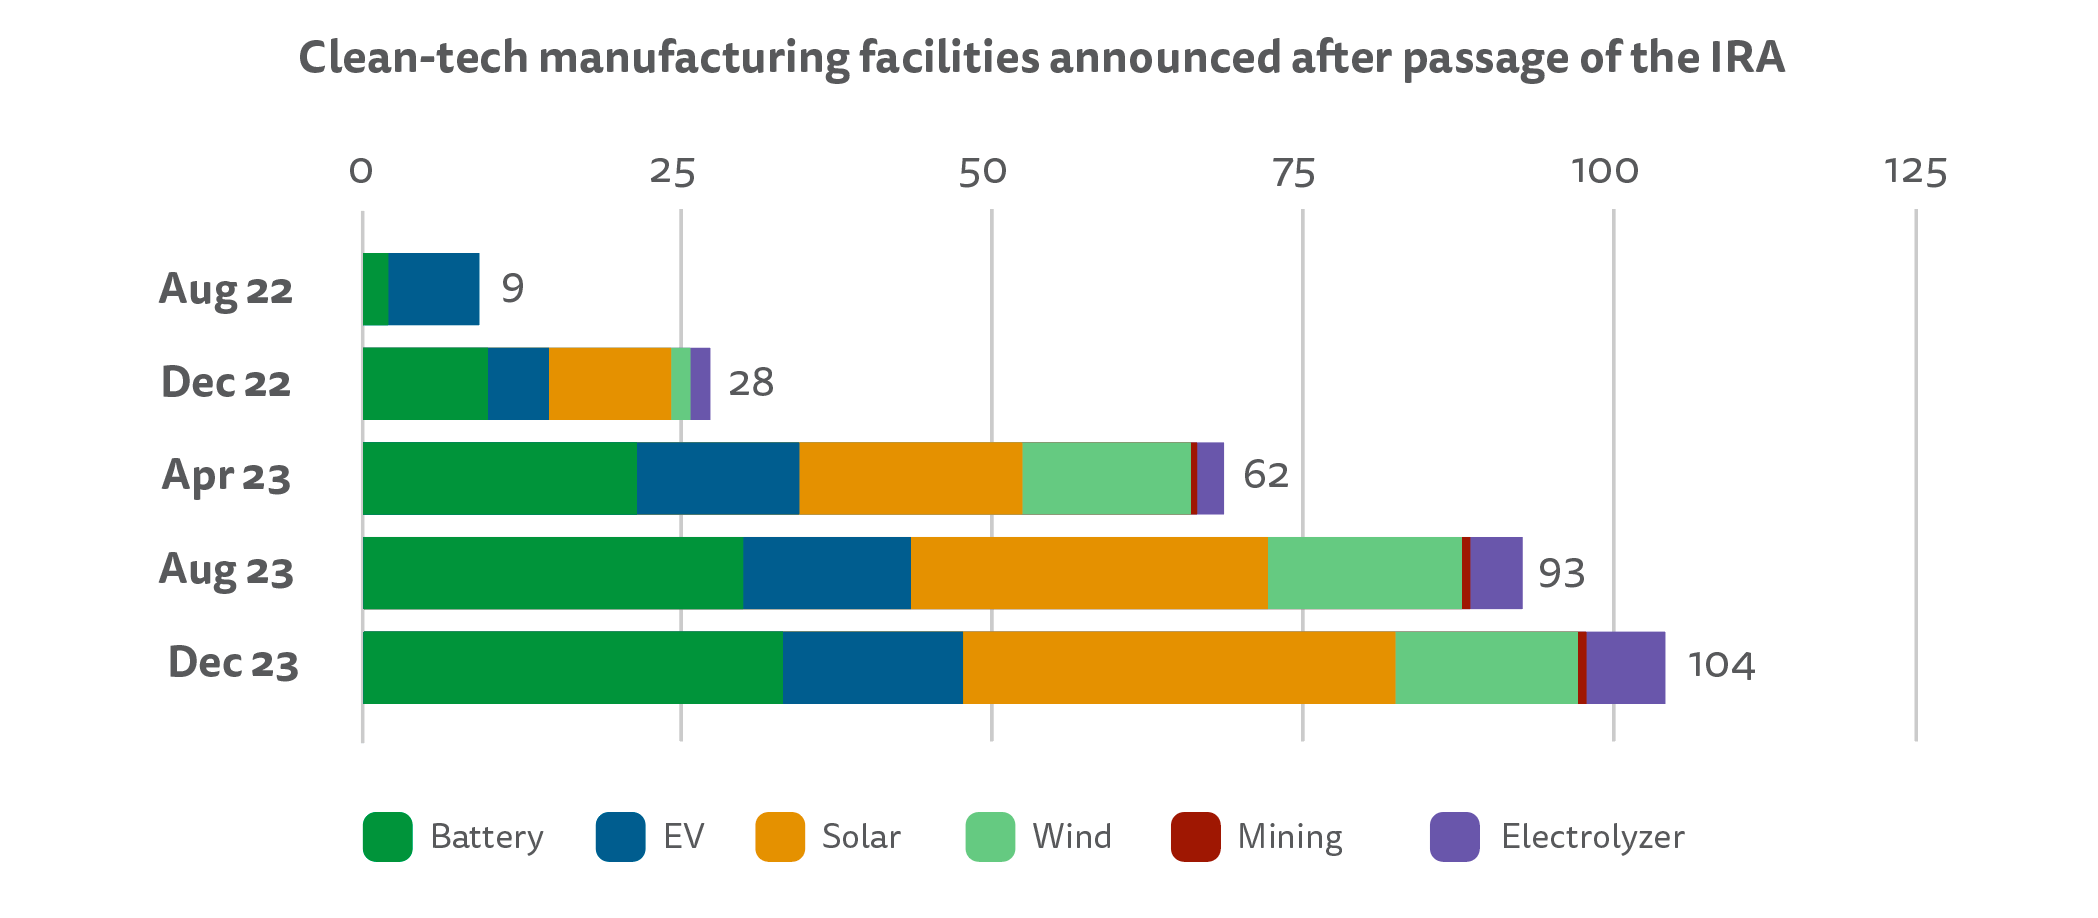
Above: Graph depicting clean-tech manufacturing facilities announced after passage of the IRA, as of December 2023. Source: 2024 Sustainable Energy in America Factbook by the Business Council for Sustainable Energy (BCSE) and BloombergNEF.
The 2024 Sustainable Energy in America Factbook, published annually by the Business Council for Sustainable Energy and BloombergNEF, reports on the macroeconomic trends occurring across clean energy industries. The 2024 edition features sector-by-sector market responses to the IRA, signaling the positive impact that the legislation has had on energy storage, hydrogen, private sector investment, and manufacturing, to name a few.
While industry-wide growth occurred, emerging technologies lead the charge as the fastest growing sectors, including a 68% increase in new carbon capture and storage investments, 82% jump in hydrogen-producing project investments, and an 81% rise in supply of renewable jet fuel since 2022.
Impact of the Inflation Reduction Act
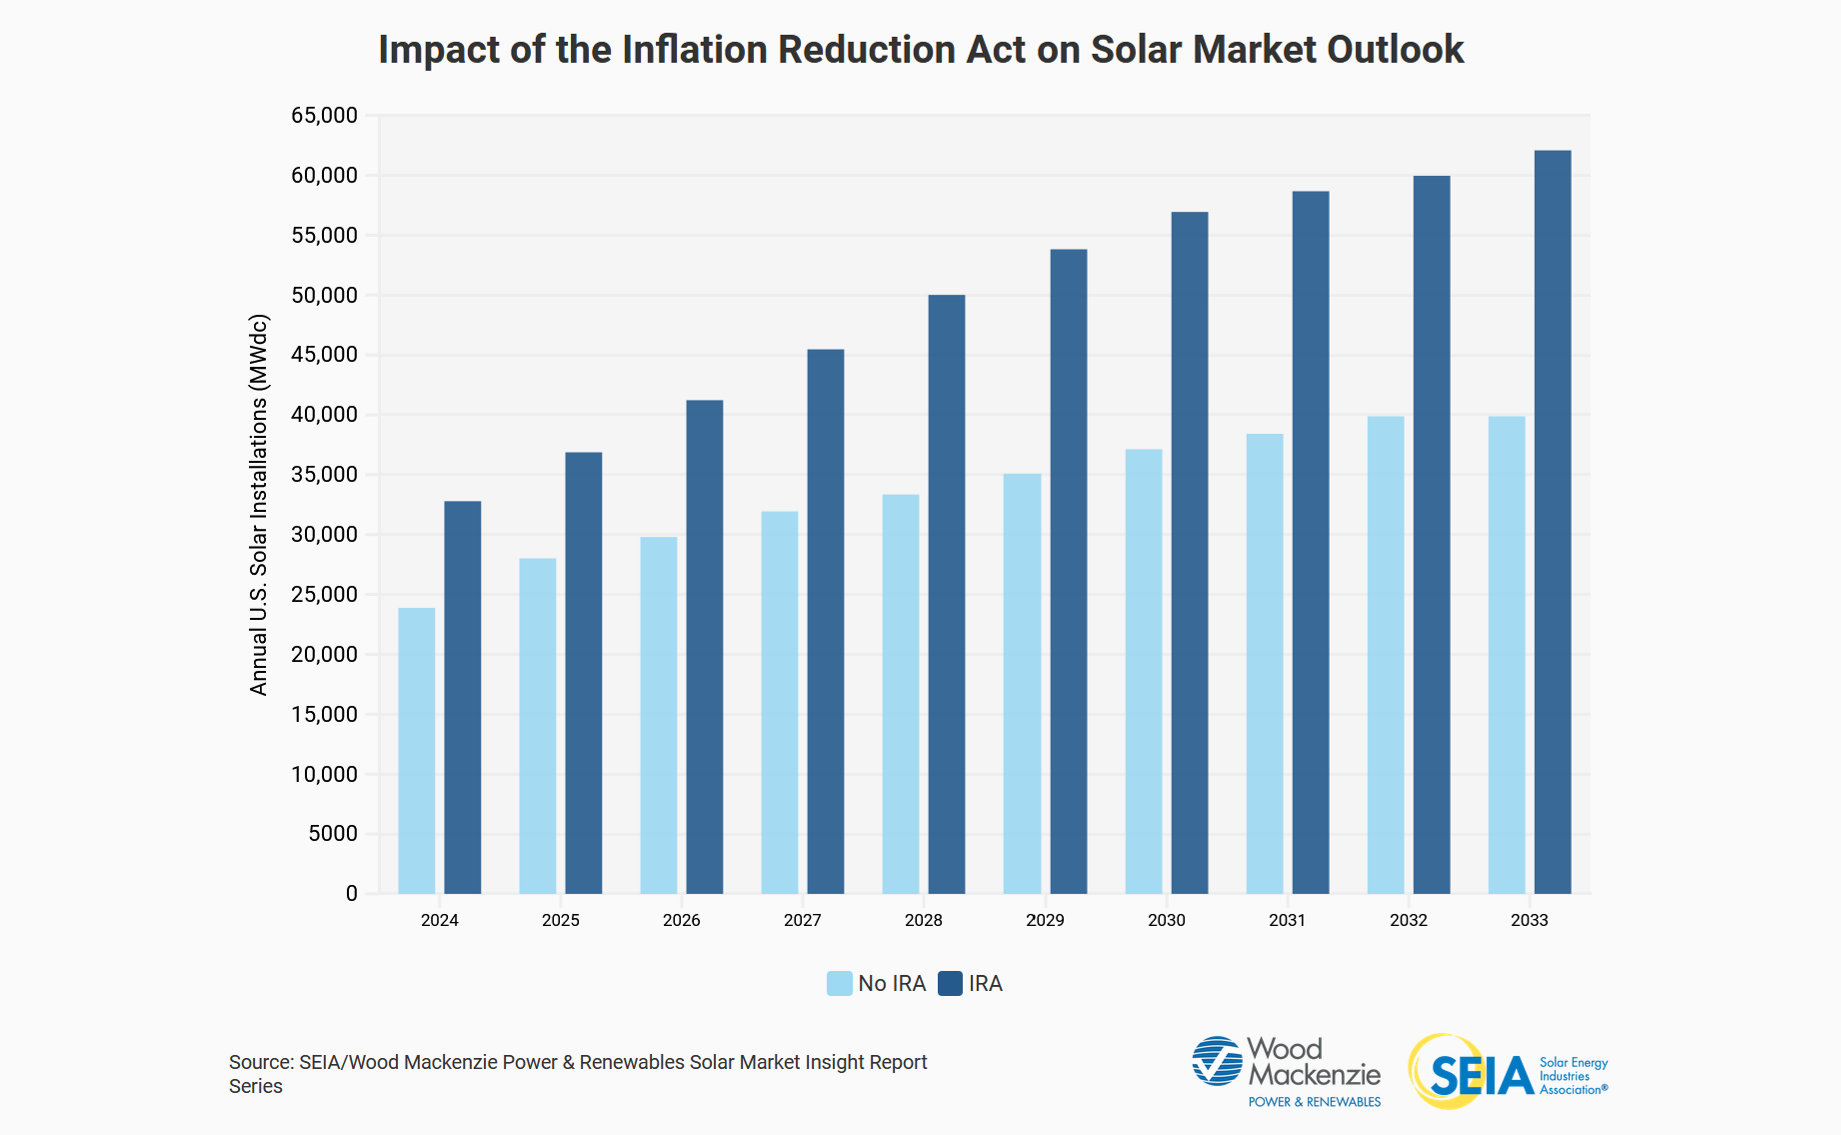
Above: Graph comparing projected annual U.S. solar installations under an IRA investment scenario and no IRA investment scenario. Source: Impact of the Inflation Reduction Act Factsheet by the Solar Energy Industries Association (SEIA) and Wood Mackenzie.
This factsheet from BCSE member Solar Energy Industries Association summarizes the rapid growth the solar industry has seen since the passage of the IRA and charts anticipated future growth, spurred by the IRA’s clean energy investments. Over the next 10 years, the IRA is expected to drive “48% more solar deployment” and “increase CO2 emissions offsets from 169 million metric tons (MMT) today to more than 459 MMT by 2033.” The factsheet gives topline facts on job creation, manufacturing capacity expansion, and private sector investment in the solar industry.
Inflation Reduction Act Tracker
The IRA Tracker is a collaboration between the Columbia Law School’s Sabin Center for Climate Change Law and the Environmental Defense Fund. The tracker highlights the 282 actions taken by 16 government agencies to implement climate change-related provisions of the IRA.
The IRA Database provides an overview of these provisions, organized by federal agency. Being highly filterable, users can view agency actions based on IRA section, agency, eligible entity, or action type (i.e., announcement vs. final rule). For further information, agency actions are accompanied by links with “opportunities for participation and additional resources.”
Federal Funding Tracker for Buildings
In partnership with the U.S. Environmental Protection Agency (EPA), the National Association of State Energy Officials (NASEO) created the Federal Funding Tracker for Buildings. This database captures the ongoing key funding opportunities provided by the IRA and the 2021 Infrastructure Investment and Jobs Act (IIJA), including 29 active programs totaling $50 billion in funding.
The programs outlined in this tracker vary by funding amount, eligibility, disadvantaged community prioritization, and more. For a quick glimpse at what is to come, note the “Next Program Milestone Date/Description.” To filter the tracker by additional fields, make a copy of the sheet and get full editing access.
The Inflation Reduction Act: A Place-Based Analysis
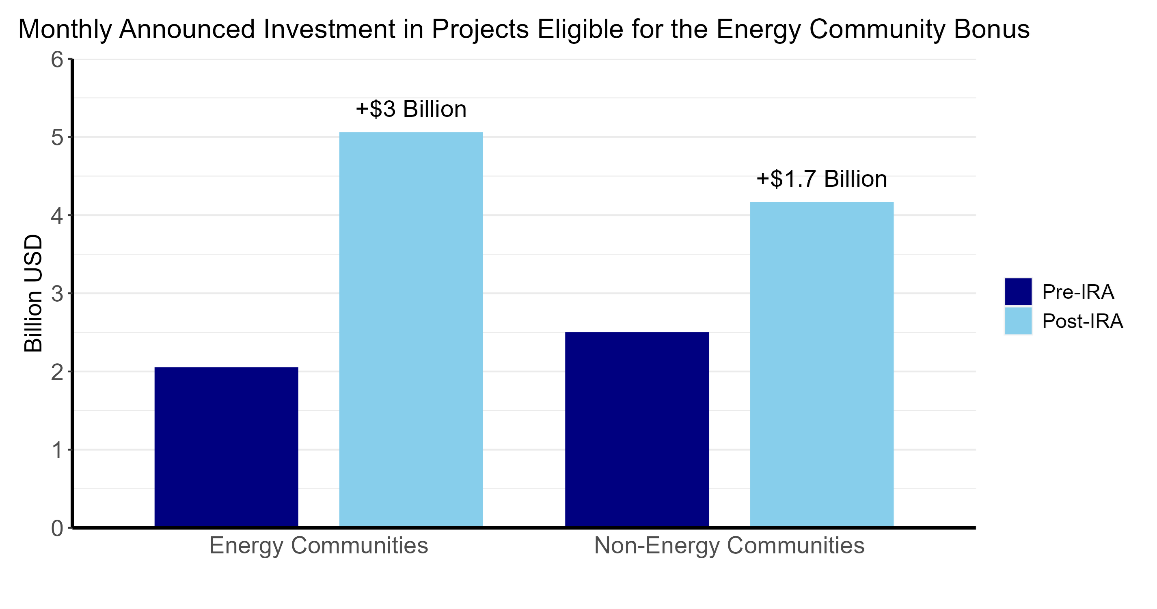
Above: Graph comparing monthly announced investment in projects eligible for the IRA’s Energy Community Bonus, pre-IRA funding and post-IRA funding, as of November 2023. Source: The Inflation Reduction Act: A Place-Based Analysis by the U.S. Department of the Treasury.
An analysis from the U.S. Department of Treasury highlights that the IRA is driving clean energy investments to underserved communities and energy communities at the forefront of fossil fuel production. Using data from MIT and Rhodium Group’s Clean Investment Monitor, this study concluded over 80% of post-IRA clean investments have gone to counties with below-average wages and more than 85% have gone to counties with below-average college graduation rates. The analysis finds investment is booming across the country, but it is growing even faster in energy communities which have historically depended on economic activity from coal mines or fossil fuel power plants.
Tracking Clean Energy Announcements
White House Investing in America Tracker
![]()
Above: Map depicting private investments in clean energy manufacturing, batteries/EVs, clean power, and more, as of April 2024. Source: Investing in America map by the White House.
This interactive map provides a snapshot of the thousands of clean energy, infrastructure, manufacturing, and electricity projects that have been introduced across the United States since the passage of the IRA and IIJA.
To date, $41.5 billion has been “announced for grants, rebates, and other initiatives to accelerate the deployment of clean energy, clean buildings, and clean manufacturing.” With an advanced search under “Public Infrastructure”, the map filters projects by funding source, funding agency, and program name.
Clean Energy Investing in America
Above: Map depicting new utility-scale clean energy manufacturing facilities announcements since the passage of the IRA, as of April 2024. Source: Clean Energy Investing in America report by the American Clean Power Association (ACP).
BCSE member American Clean Power Association tracks announcements of new or expanded utility-scale manufacturing facilities since the passage of the IRA through their interactive Clean Energy Investing in America report. Included in these 140 announcements is 303,150 MW provided by projects and $4.5 billion in customer savings.
The tracker details the number of announcements in the battery, solar, and wind sectors and their impact on manufacturing capabilities, capital investment, and clean power capacity. To help keep this report up-to-date, fill out this form to add a manufacturing facility announcement to future updates.
Clean Economy Works
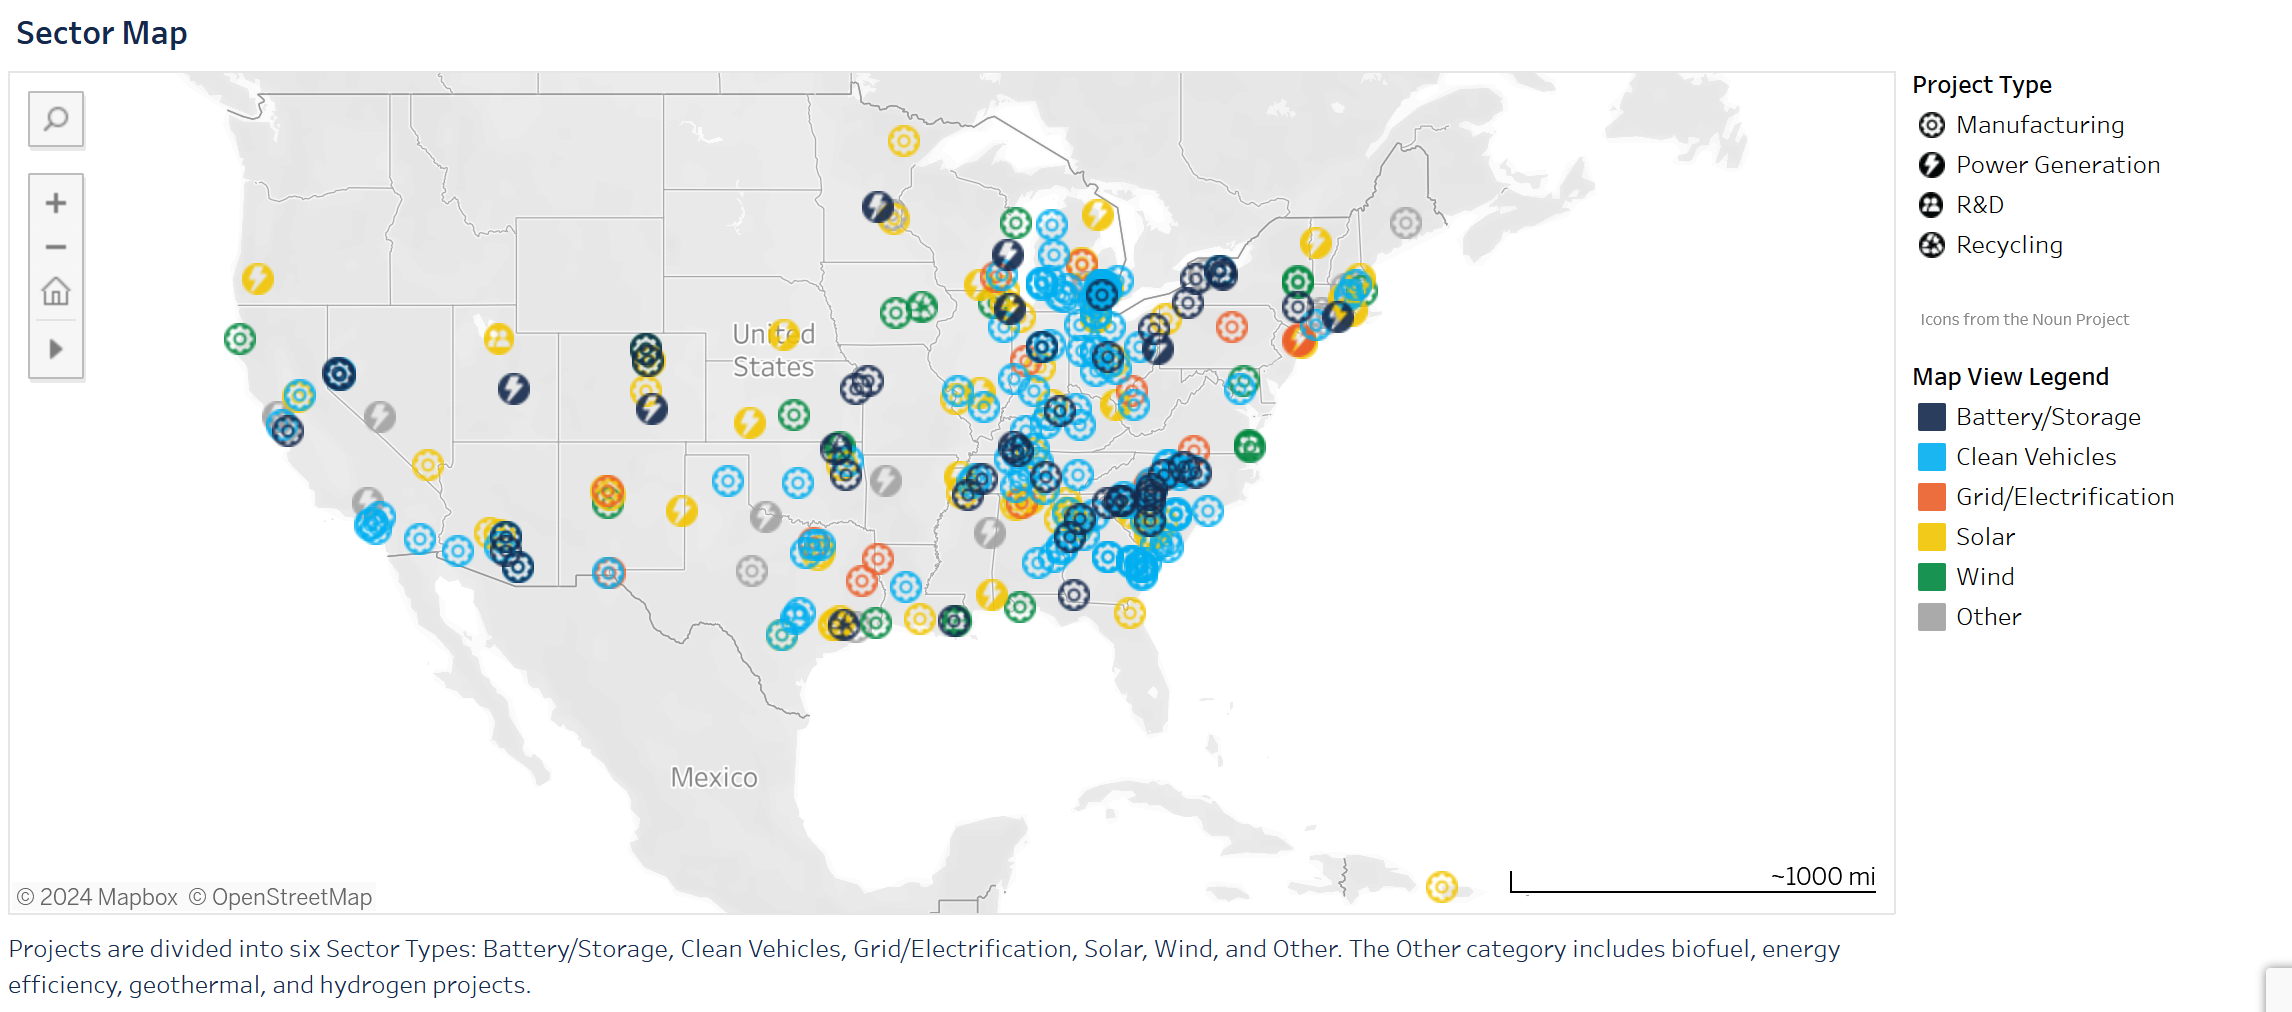
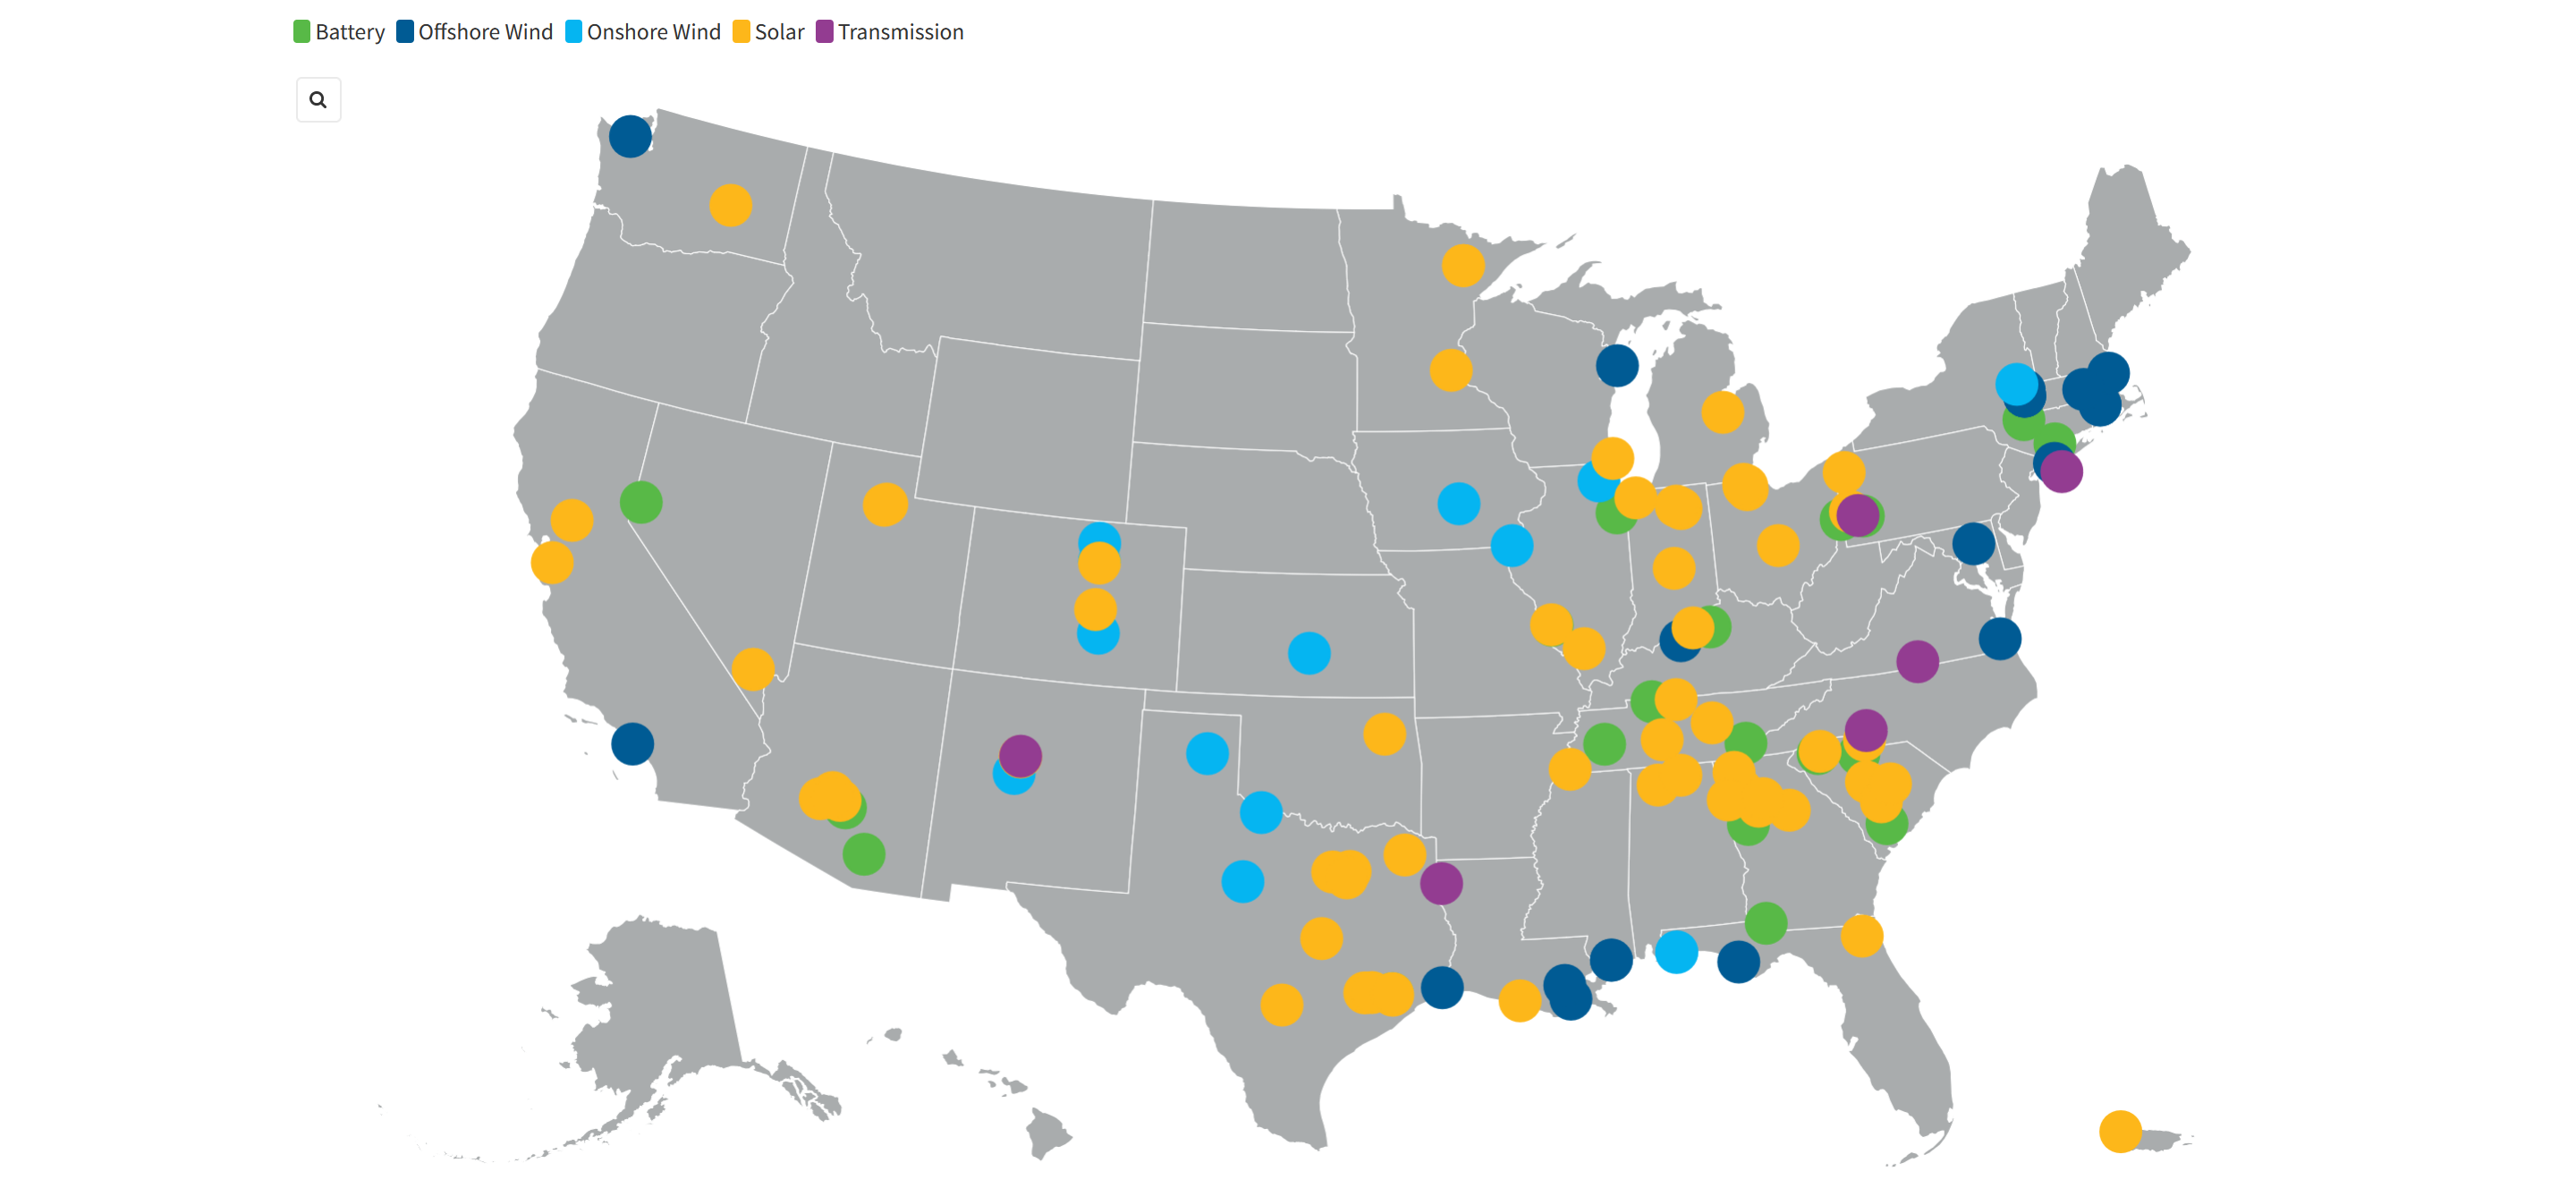
Above: Map depicting major clean energy project announcements since the passage of the IRA, as of March 2024. Source: Clean Economy Works by E2.
Created and maintained by E2, this interactive tool provides a live map illustrating 292 newly announced large-scale clean energy projects covering 41 states since the passage of the IRA. Broken down by project type and sector, the map can be filtered by state or announcement date.
For an added level of specificity, all new projects are listed below the map with links to the original announcements and statistics on job creation and investment totals. All data is based on publicly available information.
Clean Investment Monitor
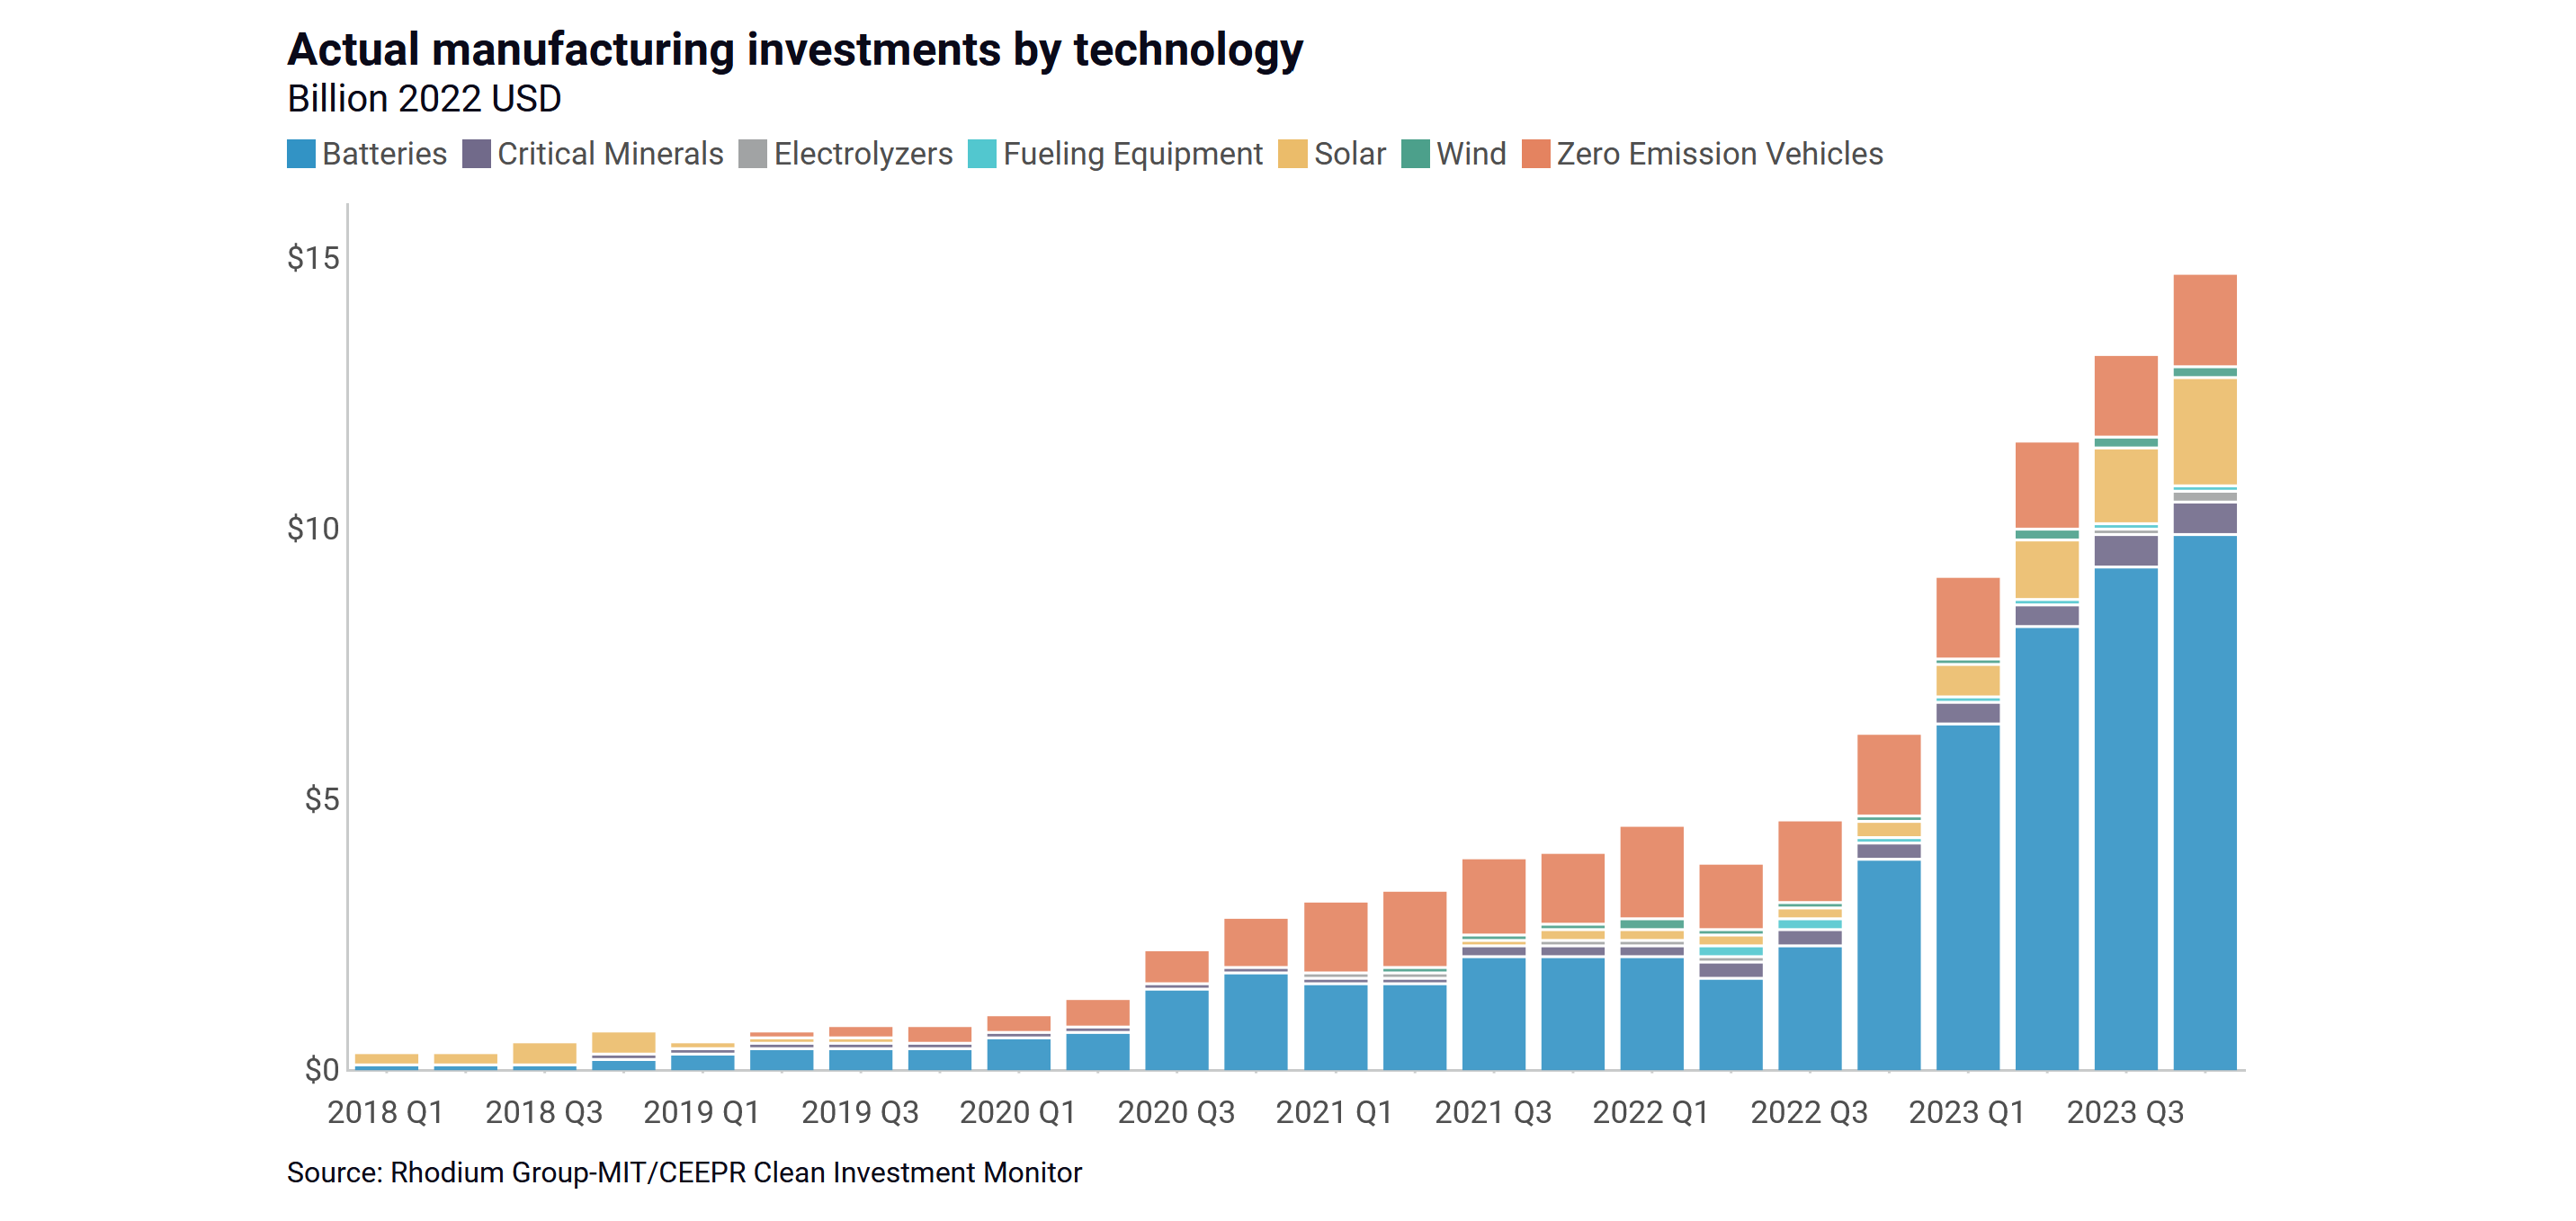
Above: Graph depicting U.S. manufacturing investments from Q1 2018 to Q4 2023. Source: Clean Investment Monitor by Rhodium Group and MIT.
Maintained by the Rhodium Group and MIT Center for Energy and Environmental Policy Research, the Clean Investment Monitor updates every quarter with data tracking clean energy investments in manufacturing, industry, and retail. Of note was a 38% increase in new investment in the manufacturing and deployment of clean energy, clean vehicle, building electrification, and carbon management tech from 2022 to 2023, totaling $239 billion.
Supplementing the tracker is the Assessing Progress in Electricity and Transport Report, comparing actual clean energy progress with projections of the impact of the IRA and the IIJA based on research from Energy Innovation, the REPEAT Project, and the Rhodium Group. Current data reveals that zero emissions vehicle sales are on track to meet the IRA’s objective of reaching a 40% reduction in emissions by 2030.
Clean Economy Tracker
![]()
Above: Graph comparing investments at clean energy and technology manufacturing facilities in Republican and Democratic congressional districts from 2016 to 2024. Source: Clean Economy Tracker by Atlas Public Policy and Utah State University.
Developed by Atlas Public Policy and Utah State University, the Clean Economy Tracker is a highly filterable tool tracking investment and job growth in clean energy manufacturing and development across the country. Updated weekly, the tracker allows users to visualize investment trends by sector, congressional district, and community type (energy, rural, or low-income).
An analysis of the manufacturing overview reveals that 76% of the $160 billion in announced investments in manufacturing facilities since 2022 are in Republican congressional districts. The tracker also includes visualizations of U.S. Department of Energy demonstration projects across the country.
Clean Technology Tracker
![]()
Above: Map depicting new investment in carbon management, clean hydrogen production, hydrogen electrolyzer manufacturing, and sustainable aviation fuel from October 2018 to December 2023. Source: Clean Technology Tracker by Cipher.
Dig into the investment and deployment trends of four emerging clean energy technologies with Cipher’s Clean Technology Tracker. The tool’s interactive map depicts the progress of carbon management, clean hydrogen production, electrolyzer manufacturing, and sustainable aviation fuel technologies.
Between the four key areas, clean hydrogen production and electrolyzer manufacturing account for a total investment of $49,070 billion as of 2023. As non-conventional renewable energy sources populate the market, policymakers, investors, and power producers alike can rely on resources like the Cleantech Tracker to monitor development pipelines and inform their decisions on the clean energy transition.
Measuring Emissions Reductions
Reports from the U.S. Environmental Protection Agency (EPA) and Department of Energy (DOE)
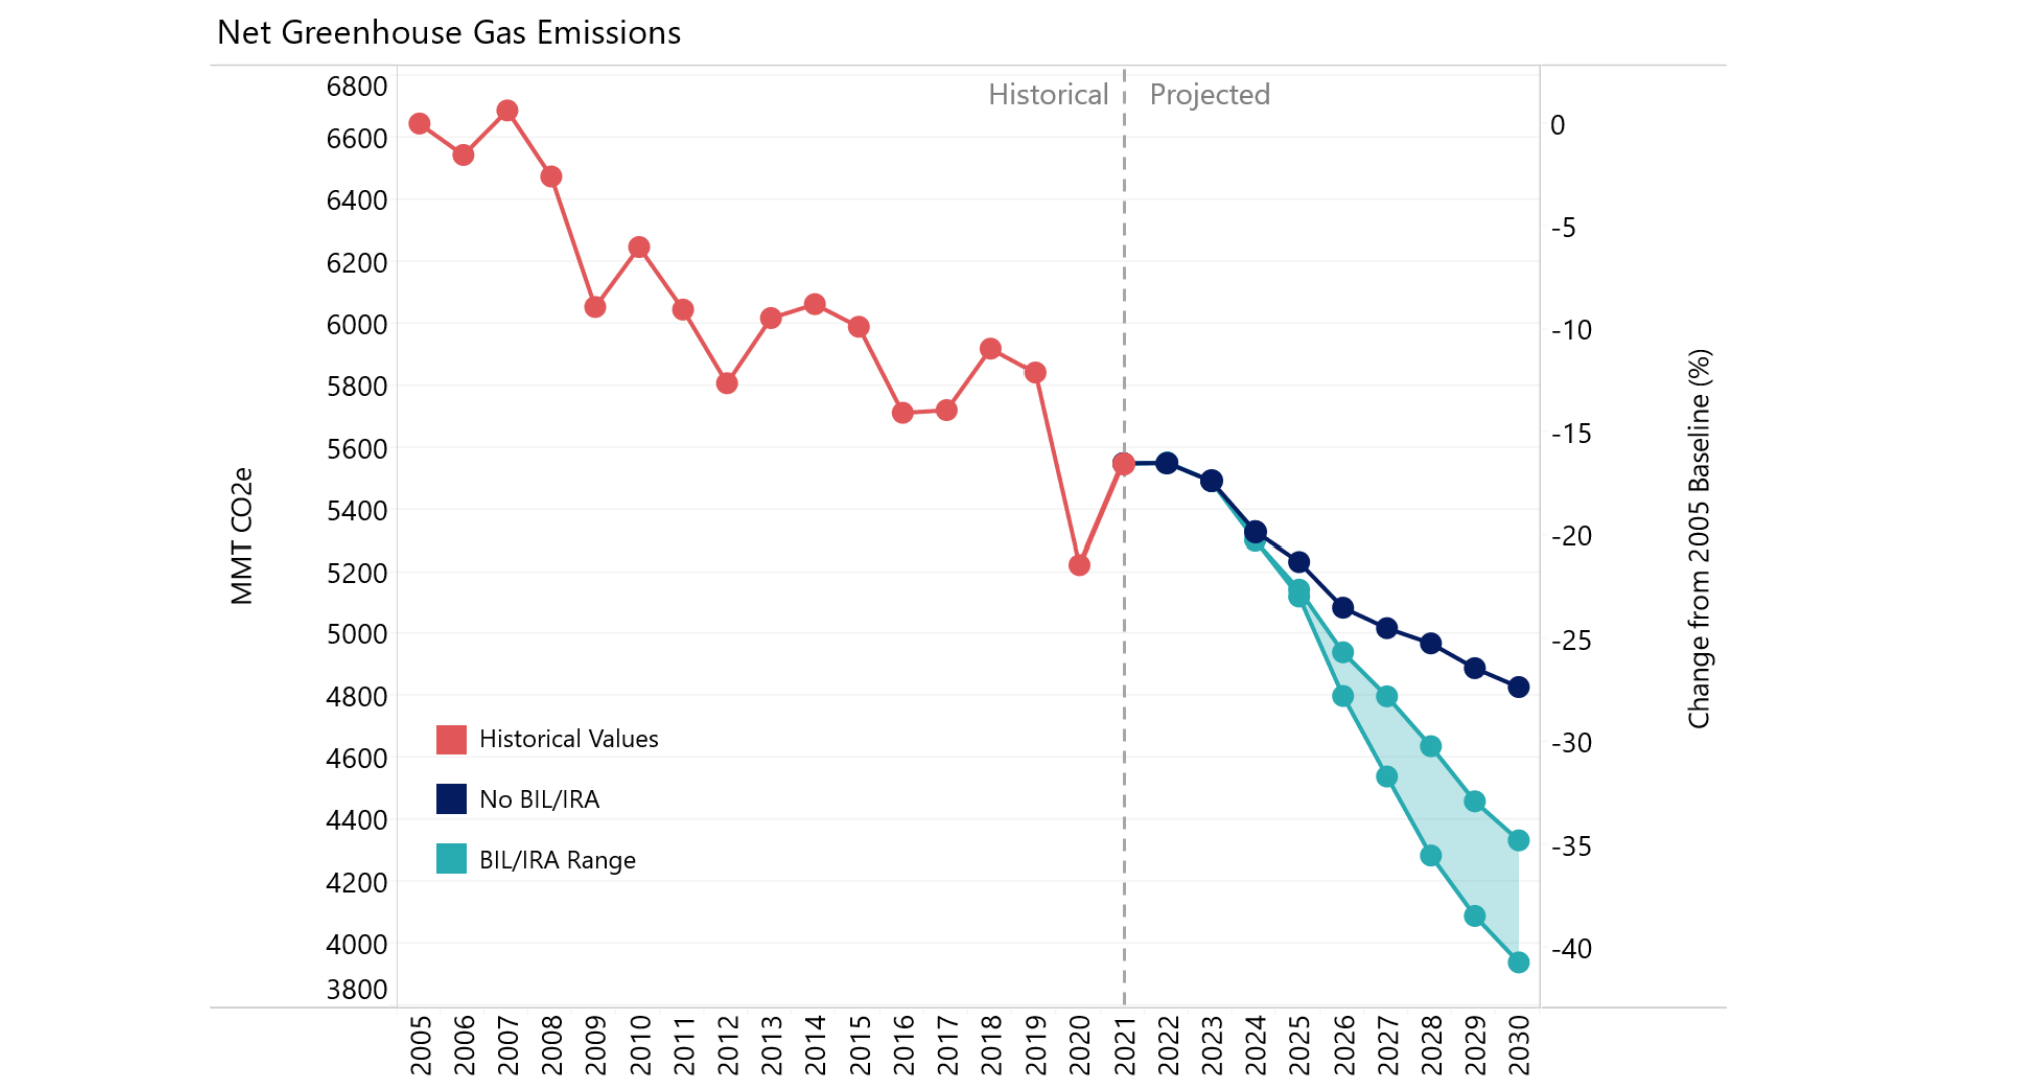
Above: Graph comparing projected U.S. net greenhouse gas emissions under an IRA/IIJA investment scenario and no IRA/IIJA investment scenario. Source: Investing in American Energy report by the U.S. Department of Energy.
Released in September 2023, the EPA’s Electric Sector Emissions Impacts of the Inflation Reduction Act report tracks and projects sector-by-sector improvements – attributable to the IRA – in limiting direct and indirect emissions. By comparing two scenarios – no IRA vs. IRA – the report offers a comprehensive look at economy-wide emissions trends and identifies key IRA provisions contributing to these positive results.
Similarly, the Investing in American Energy (Aug. 2023) report from the U.S. Department of Energy examines three scenarios of potential long-term impacts of the IRA – no IRA, moderate IRA implementation, and advanced IRA implementation. In an advanced scenario, the analysis predicts GHG emissions to decline to 35%-41% below 2005 levels by 2030.
Clean Energy Jobs Growth
Clean Economy Works Report
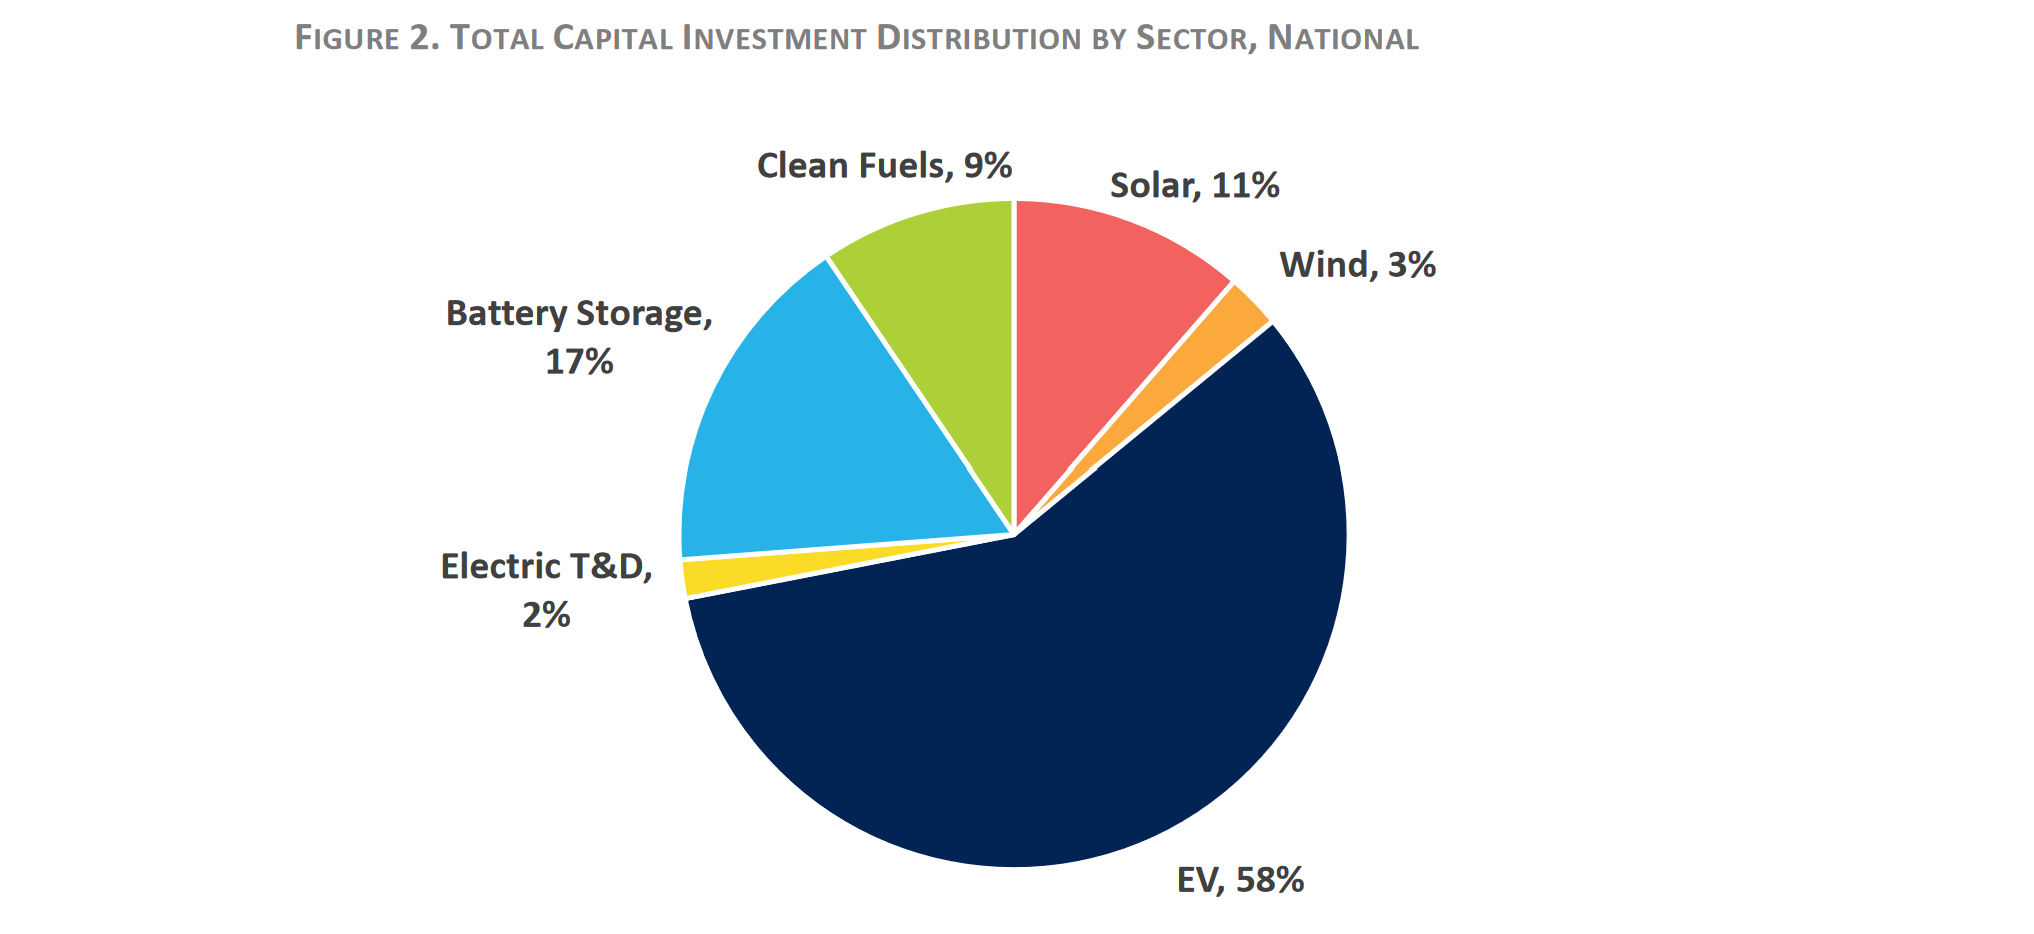
Above: Graph depicting the total capital investment distribution by clean energy sector. Source: Clean Economy Works report by E2 and BW Research.
Drawing from E2’s clean energy projects tracker, this report summarizes the economic benefits resulting from new major clean energy projects induced by the IRA over the next five years. Of note are more than 400,000 jobs created or supported each year across the solar, wind, EV, electric transmission and distribution, battery storage, and clean fuels sectors and $106.4 billion in total private investment. Appendix C features a list of announced projects used in the analysis sorted by sector.
The State of the Clean Energy Boom
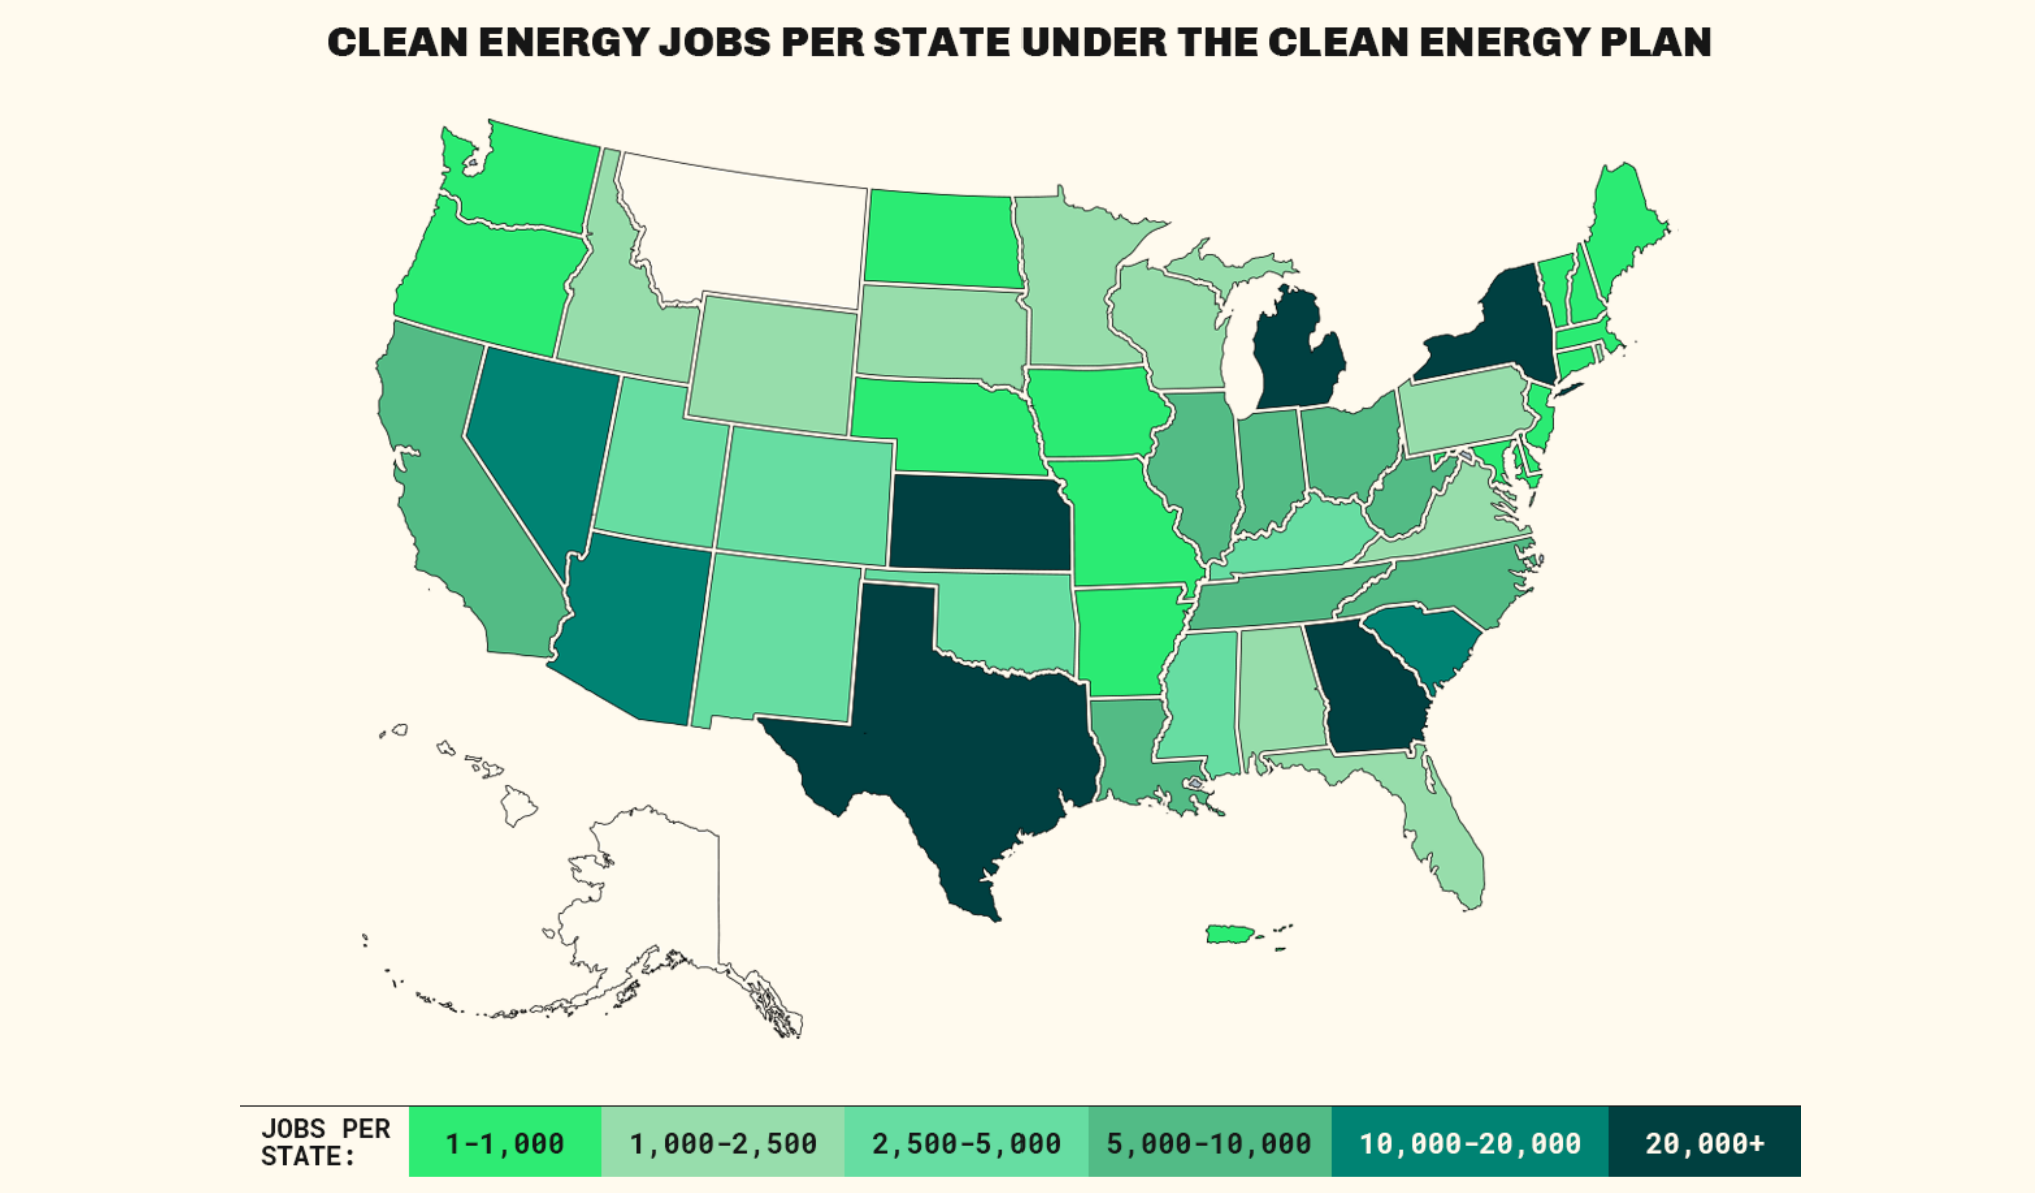
Above: Map depicting new clean energy jobs since the passage of the IRA, as of March 2024. Source: State of the Clean Energy Boom report by Climate Power.
Produced by Climate Power and updated every two months, the State of the Clean Energy Boom report tracks new jobs stemming from clean energy project announcements made since the passage of the IRA. Between August 2022 and March 2024, “271,713 jobs across 47 states and Puerto Rico” were created owing to projects totaling $352 billion in new investments.
Broken down by state and even congressional district, the report offers a more granular look at how investments are being made on a community level. Clean Energy Boom reports for individual states can also be found.
About the author: Chaney Keck is BCSE’s communications assistant.